Introduction to Data Science with Energy Data : Data cleansing
Let’s explore a process of data science through the new data set we just got. It is an energy consumption data we have with our data center. In our data center, we have setup 10 more meters with data loggers. People who are interested can read our case study here.
Consider a server room containing two racks connected to channels: ULC5, ULC5. This room has two CRACs blowing in underground, called CRAC3, CRAC4. The two CRACs are turned on-off daily alternatively. The temperature setting is fixed.
We setup the meters logging the four channels. Let’s skip the process of setting the meters and logging for now. In short, the meters log data to the database and we exported the database to CSV.
To make it simple, the data is downloaded from http://datascience.ku.ac.th/16-2/ at googledrive. The data is in CSV file with the header on the first line. Totally, there are about 50 more fields. The first column is Timestamp (in the form 16/05/2018 14:41:02), and the second column is dev_name, which can be UDB1_ULC_5,UDB2_ULC_6,ADB1_CRAC3, ADB1_CRAC4,… which correspond to the meter channels.
Suppose that we are predicting Consumed energy kWh.
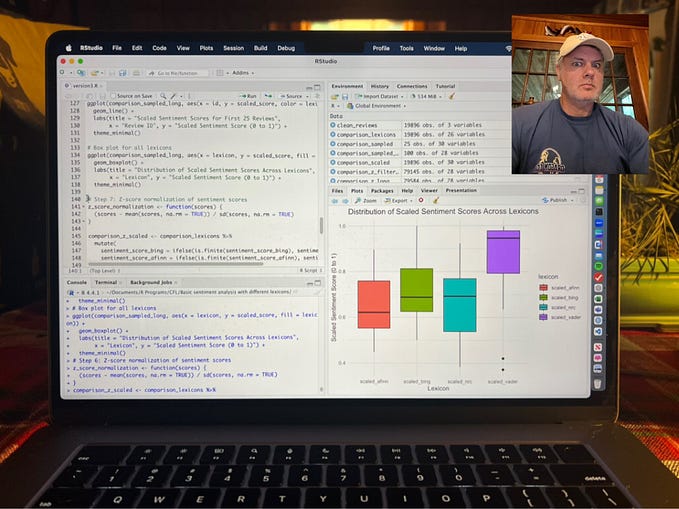
We explore the data set and show the graph of consumed energy.
Here is the graph. The consumed energy should be monotonically increasing values .We can see the error in the plot indicating the meter reading errors in the data.

Now let’s eliminate the error data first. In this code, we check only the increasing values of the Consumed_active_energy_kW which is field number 49, and check the limit of the values [2000,20000].
max_val = [20000]

min_val = [2000]
field_num = [49]Running the program shows some results of lines with error values. We save the new file to powertest_CRAC3.out.csv.
….check field Consumed_active_energy_kW …not incrasing 12827 3884.0 at row 216187 [‘12/06/2018 07:16:29’, ‘ADB1_CRAC3’, ‘0.97’, ‘67.0’, ‘40.04’, ‘9.8’, ‘15.0’, ‘0.0’, ‘18.0’, ‘88.0’, ‘10080.0’, ‘224.8’, ‘0.0’, ‘9000.0’, ‘50.01’, ‘27.88’, ‘224.4’, ‘0.0’, ‘0.97’, ‘39.2’, ‘0.97’, ‘5.76’, ‘1600.0’, ‘0.0’, ‘0.96’, ‘7520.0’, ‘3895.0’, ‘8800.0’, ‘0.97’, ‘45.04’, ‘8.84’, ‘97.0’, ‘3909.0’, ‘27.88’, ‘0.097’, ‘0.097’, ‘225.7’, ‘2320.0’, ‘0.97’, ‘0.0’, ‘272.4’, ‘5.001’, ‘224.7’, ‘1800.0’, ‘388.4’, ‘3916.0’, ‘8.56’, ‘98.0’, ‘14.0’, ‘3884.0’, ‘97.0’, ‘84.0’, ‘0.0’, ‘5.76’, ‘0.97’, ‘8.56’, ‘27.2’, ‘13.0’] …not increasing 12828 3881.0 at row 216195 [‘12/06/2018 07:18:00’, ‘ADB1_CRAC3’, ‘0.94’, ‘92.0’, ‘28.28’, ‘7.08’, ‘2160.0’, ‘0.0’, ‘20.8’, ‘63.2’, ‘7560.0’, ‘224.8’, ‘0.0’, ‘6360.0’, ‘50.05’, ‘20.24’, ‘224.0’, ‘0.0’, ‘0.95’, ‘28.08’, ‘0.94’, ‘6.44’, ‘1760.0’, ‘0.0’, ‘0.93’, ‘5880.0’, ‘28080.0’, ‘6280.0’, ‘0.93’, ‘33.88’, ‘6.08’, ‘94.0’, ‘2255.0’, ‘20.2’, ‘0.094’, ‘0.094’, ‘225.6’, ‘2520.0’, ‘0.93’, ‘0.0’, ‘190.8’, ‘5.005’, ‘224.8’, ‘2120.0’, ‘388.1’, ‘2820.0’, ‘5.92’, ‘96.0’, ‘0.0’, ‘3881.0’, ‘94.0’, ‘93.0’, ‘0.0’, ‘6.44’, ‘0.94’, ‘5.88’, ‘19.08’, ‘6320.0’]….…greater than outliner data at row 386501 20193.0…greater than outliner data at row 386505…21276.0 Processed 393108 lines found 98352 line cleaned line 93924

After cleansing error row, we have eliminated some time values. In order to make a prediction, our data must be sampling in the fixed time interval. Thus, we have to find a way to make our data in the correct sampling interval.
There are several cases here. 1) If there is a missing value between time intervals, we must find a way to insert the guessed value in between. 2) if the interval is not fixed, i.e., some is short and some is long, we must re-correct the sampling time. To do this, the new time may be inserted and the new value must be inserted. There are two kinds of samplings: upsampling and downsampling. Upsampling means the scaled the data from the larger interval to the smaller interval; for example, for the yearly data to monthly data. Downsampling means the scaled the data from the smaller interval to the larger interval; for example, for hourly data to minute data. The approach is called resampling in pandas. The math used for resampling may be : interpolate, mean, last value, etc.
In the data set, powertest_CRAC3.out.csv, the interval generally is 30s.
2018–05–16 14:41:16 1.00 756.0 …
2018–05–16 14:41:46 1.00 757.0 …
2018–05–16 14:42:16 1.00 759.0 …
2018–05–16 14:42:46 1.00 760.0 …
In this following code, we try to resampling different intervals. Suppose we use “means, and interpolate”. In this example, we use the same method for each column just to make it simple. It may be pained to do different methods for different columns which is needed in reality. The plots for different sampling is in Figure 3.
Let’s save the resampling file to powertest_CRAC3_clean.csv for future use.
Now we can plot the new resampling data.

Next, we are ready to explore the prediction. Since what we predict is the consumed energy data, there are two ways of predictions that we show next.
- Prediction using variables which can be power meter variables.
- Prediction based on time series.